Saturday, June 30, 2007

Basics: Technical Indicators

Technical indicators can be divided into three groups. Trend following indicators help to identify trends. oscilators help find turning points. Other indicators show the general changes in the mass pyschology.
  • trend-following indicators
    • If markets are moving trend-following indicators work best but gives false signals when the markets are flat.
    • include moving averages, MACD, Accumulation/Distribution, and others
    • they turn after the trend reverse (conincident/lagging indicators)
  • oscillators
    • If markets are flat, oscillators can help to identify turning points but gives false signals when the markets began to trend.
    • include stochastic, ROC, Momentum, RSI, Elder-ray, force index, W %R, commodity channel index and others.
    • they turn ahead of prices (coincident/leading indicators)
  • and other indicators
    • put/call ratio, new highs , new lows etc...
For more information about the indicators visit the following sites
[1] investpedia active trading
[2] Dow Jones Theory video (german)
[3] Stock Charts
[4] Trading for a living, Dr.Alexander Elder

Sunday, June 24, 2007

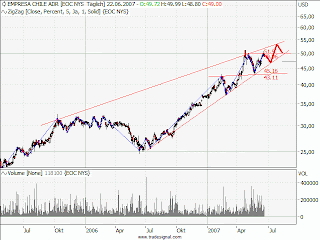
EOC (NYSE)


price target 54$

DE (NYSE)


price target 126.92

CAE


stock can go down to 78.66€ support level.
resistance level is 85.9€

WBD (NYSE)


resistance 89.31€
support 83.13€
price target 92€

ALLIANZ

resistance 179€
support 169€

K+S


price target 135

NDA


Price target 35.34
support level 32.35

MTU


price consolidation
resistance level 48.1
support level 43.62

KRN

Price target 176.08€
support level 158.24€
resistance level 174€

GEA

price target 27.85 €
resistance level 25.45 €


I bought call option to open this position.

Saturday, June 23, 2007

AMD


JCG

NAVI

NTGR

HPQ


Sunday, June 17, 2007

F

EARNINGS CYCLE


Companies report their earningn every 3 months. It is proven that earning suprises rises stock price. You can see the earnings announcments by check the earnings calendar of http://www.bloomberg.com/apps/ecal

90% of the companies report their earnings 6 weeks after the quarter.

References:
[1] http://www.decisionpoint.com/tacourse/Earnings.html

Thursday, June 14, 2007

ADBE

Tuesday, June 12, 2007

MSFT

Monday, June 11, 2007

MCD

GGB

Sunday, June 10, 2007

ADBE