Benefits of monitoring volume:
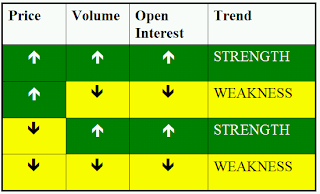
- it is possible to see if the volume and price are in agreement.
- if they are not in agreement it indicates that the trend is not strong
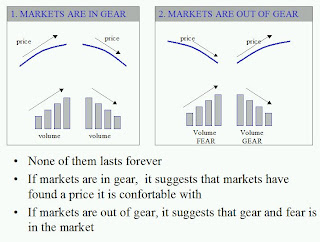
Markets are speaking with to vocabularies. They are volume and price.
Rising prices and falling volume indicates an abnormal situation and weak trend. this activitiy is associated with a primary bear market. It can be used as a bear market indicator.[3]

Dr.Elder defines the volume in connection with trendlines.
If volume expands when prices move in the direction of a trendline, it confirms that trendline; if volume shrinks when prices pull back to a trendline, it also confirms the trendlines. If volume expands when prices return to a trendline, it warns of potential break; if volume shrinks when prices pull away from a trendline, it warns that the trendline is in danger.[1]
There are more bull markets than the bear markets. Volume give different massages in bull and bear markets. In bull markets, if prices do not increase at the top of the movement and high volume appears, it indicates that distribution is taking place. In the bear markets, if prices do not fall appreciably and high volume appears at the bottom, it signifies that accumulation has been completed and the turn is near[2].
Resources:
[1] Trading for a living, Dr. Elder, p.88-92
[2] Oriline, D.Foster Ticker Technique (1935)
[3] Technical analysis explained, Martin Pring,p.397-404


